Execution Log
Execution Log allows you to review the actual calls that clients of MockMotor perform, including their HTTP properties (URI and headers) and the payload, as well as what reaction and account MockMotor used, what response payload was generated and how long the response took.
For performance reasons, only the last 100 exchanges are available.
You can further reduce the log rotation speed by switching the log into Errors Only mode, where only the responses that generated HTTP 5xx and HTTP 4xx codes are logged.
Visiting Execution Log
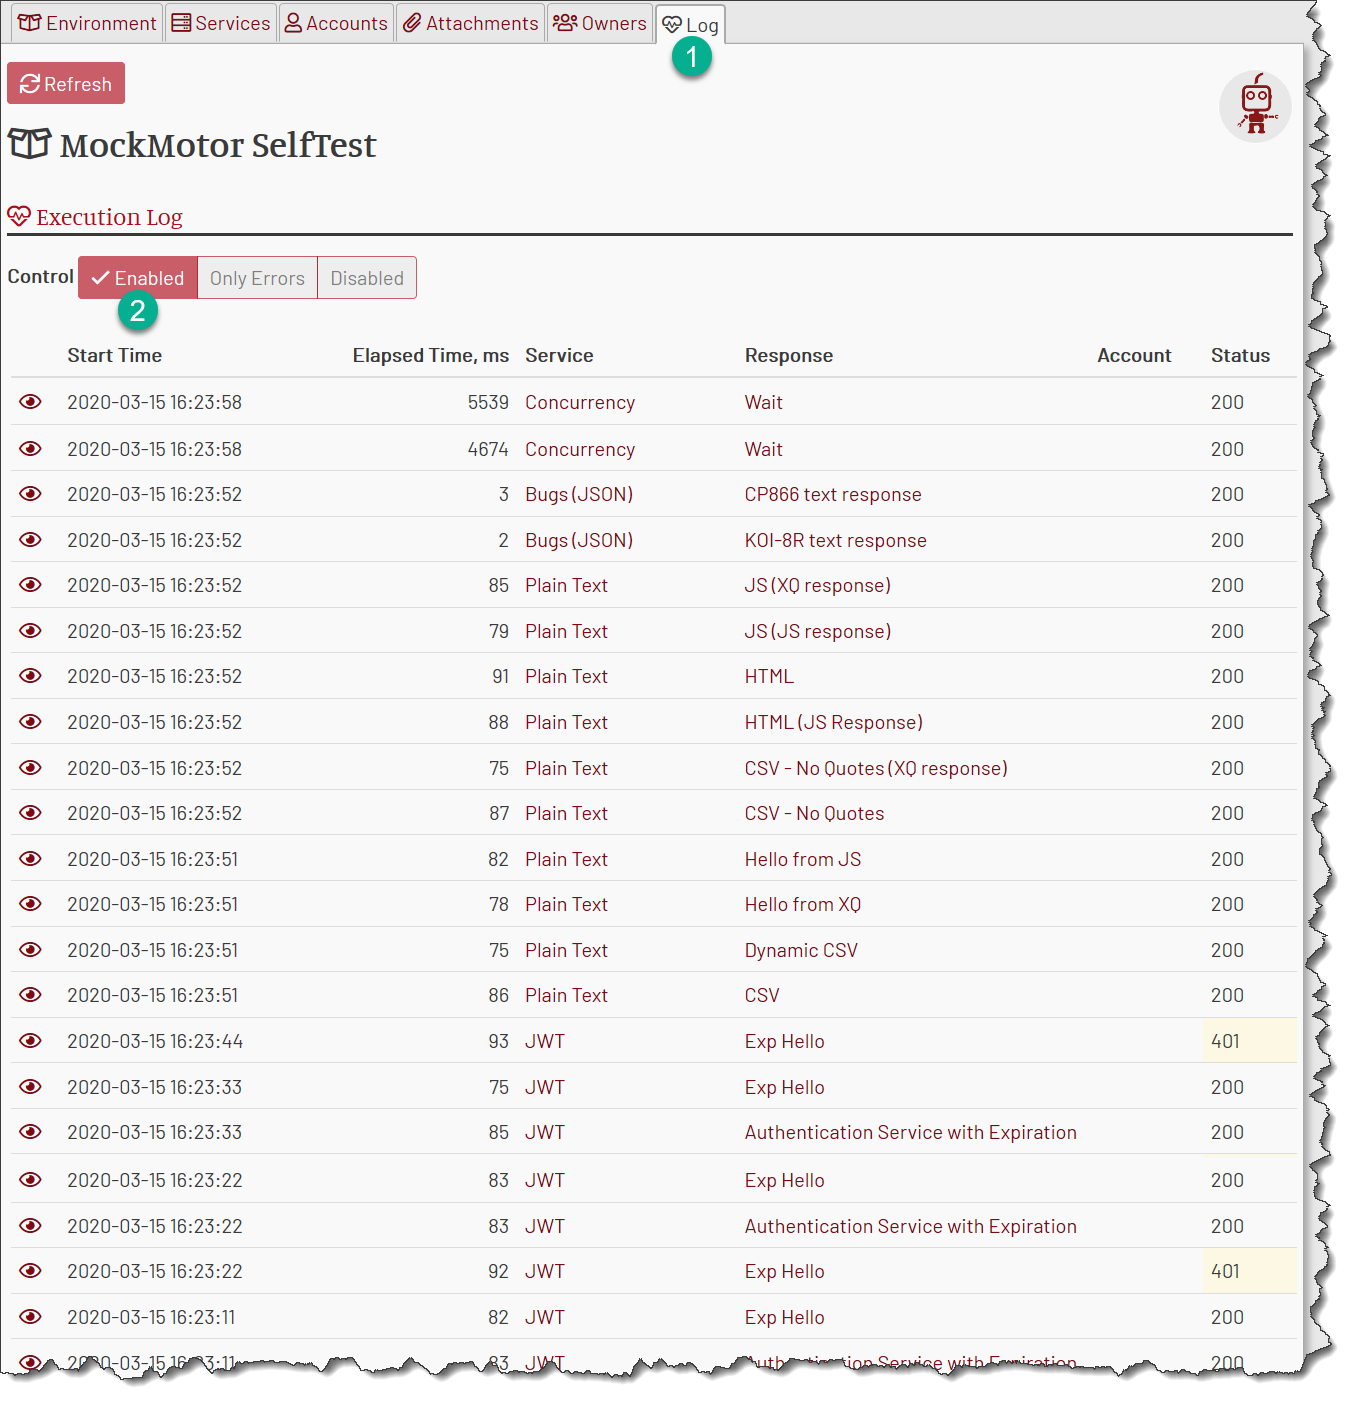
On the Environment page, click on the Log button. Make sure it is Enabled:

The log shows the most recent call first.
Each entry contains the call timestamp, elapsed time, mock service that got called, the reaction that was matched, mock account (if any) and the status.
Entries are not auto-updated, you’d need to refresh the page to see the most recent 100 calls.
Execution Log Entry
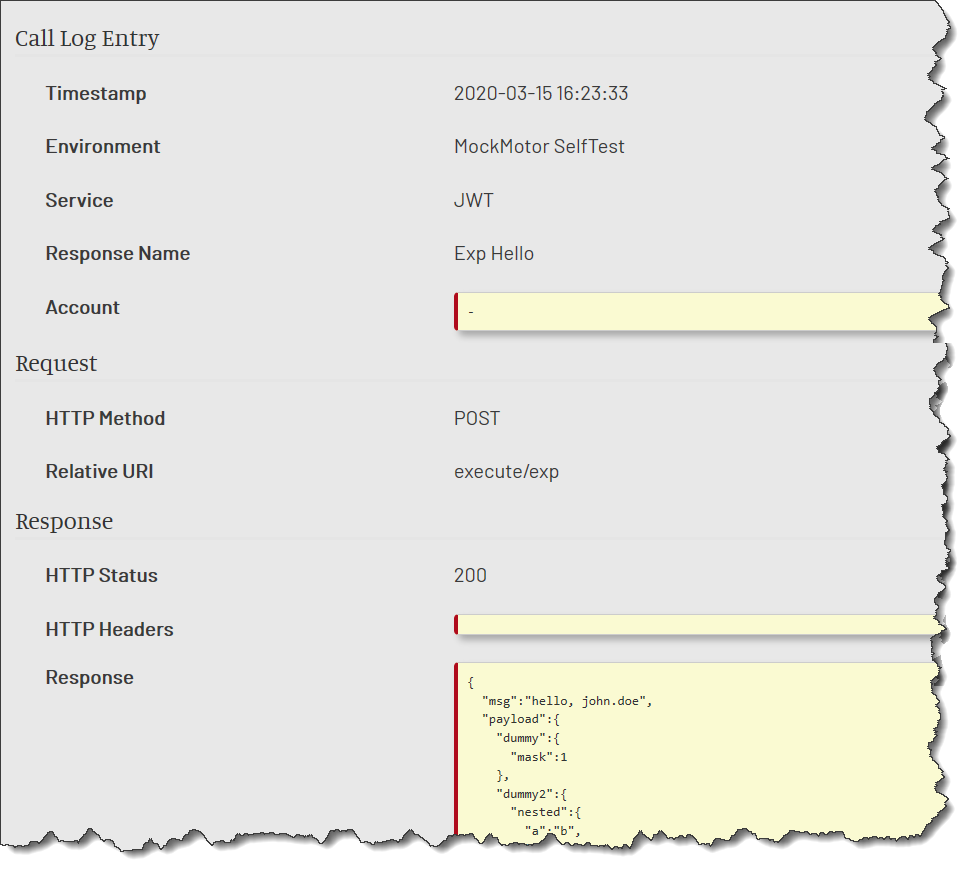
When clicking on an eye icon on the left side of an entry, you can review the full exchange, i.e. see all the properties of the request and response:

Note that the log entry URL is semi-permanent. It will live for about 24 hours and can be forwarded to someone for a quick look.
Enabling/Disabling Execution Log
The execution log can be enabled or disabled in two places:
1 Environment page
2 Execution Log page
In both places, the log can be switched into one of three possible states:
1 Disabled: No traffic gets logged. This provides minimal overhead and may be useful for heavier load tests.
2 Enabled: All traffic is logged. The log can be rotated too quickly for you to see all the requests.
3 Errors Only: Only traffic resulted in HTTP 4xx and 5xx is logged. This is very useful for fixing a small number of requests that have failed during a large load test.