 MockMotor
Response Debug
Debug Execution is a way to troubleshoot your reactions if they do not behave in the way you expect them to.
In the Debug Execution mode, MockMotor reports to you all the actions that it takes when it matches the request with the reactions and what was the result of those actions - did the match worked, what was the selected account, what payload was produced and so on. It allows you to quickly spot the point at which the execution did not go as expected so that you can fix it.
Open Debug UI
On the Reaction page, click on the Debug button:
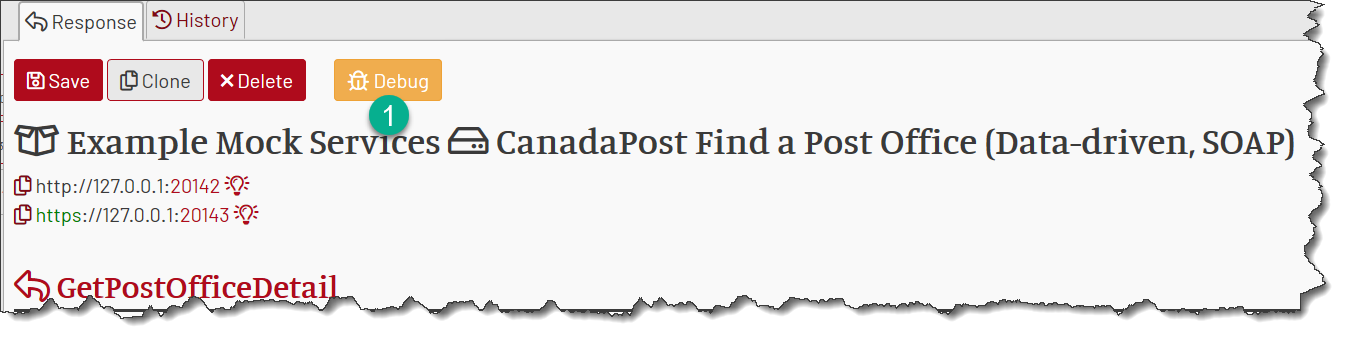
A new window opens with the Debug UI.
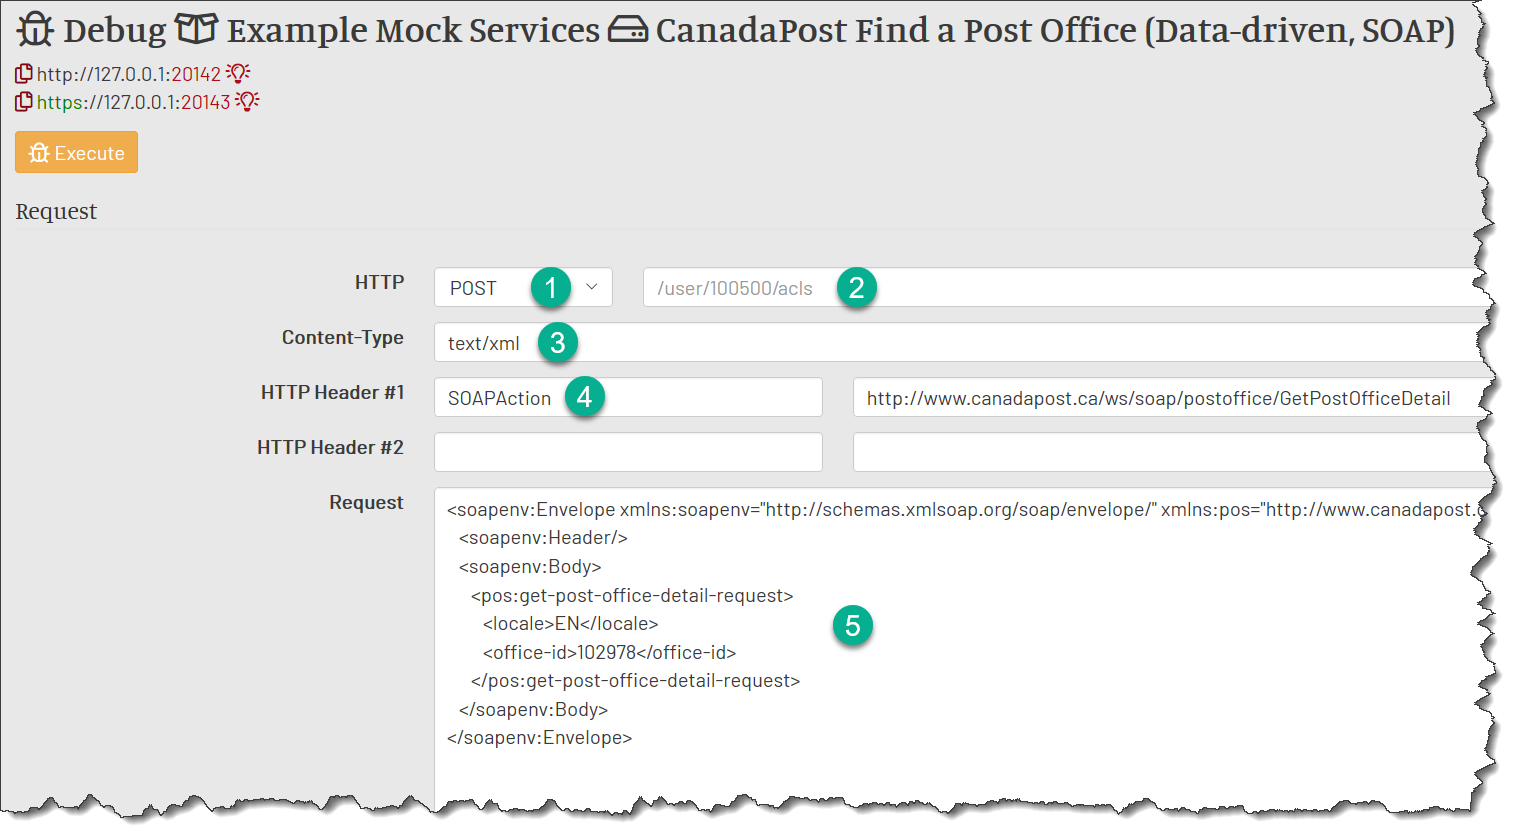
MockMotor prepopulates some of the fields for you. You need to fill the rest:
Execute the Request
Now click on Execute:
After a short delay, at the bottom of the page, you’ll see the execution log:
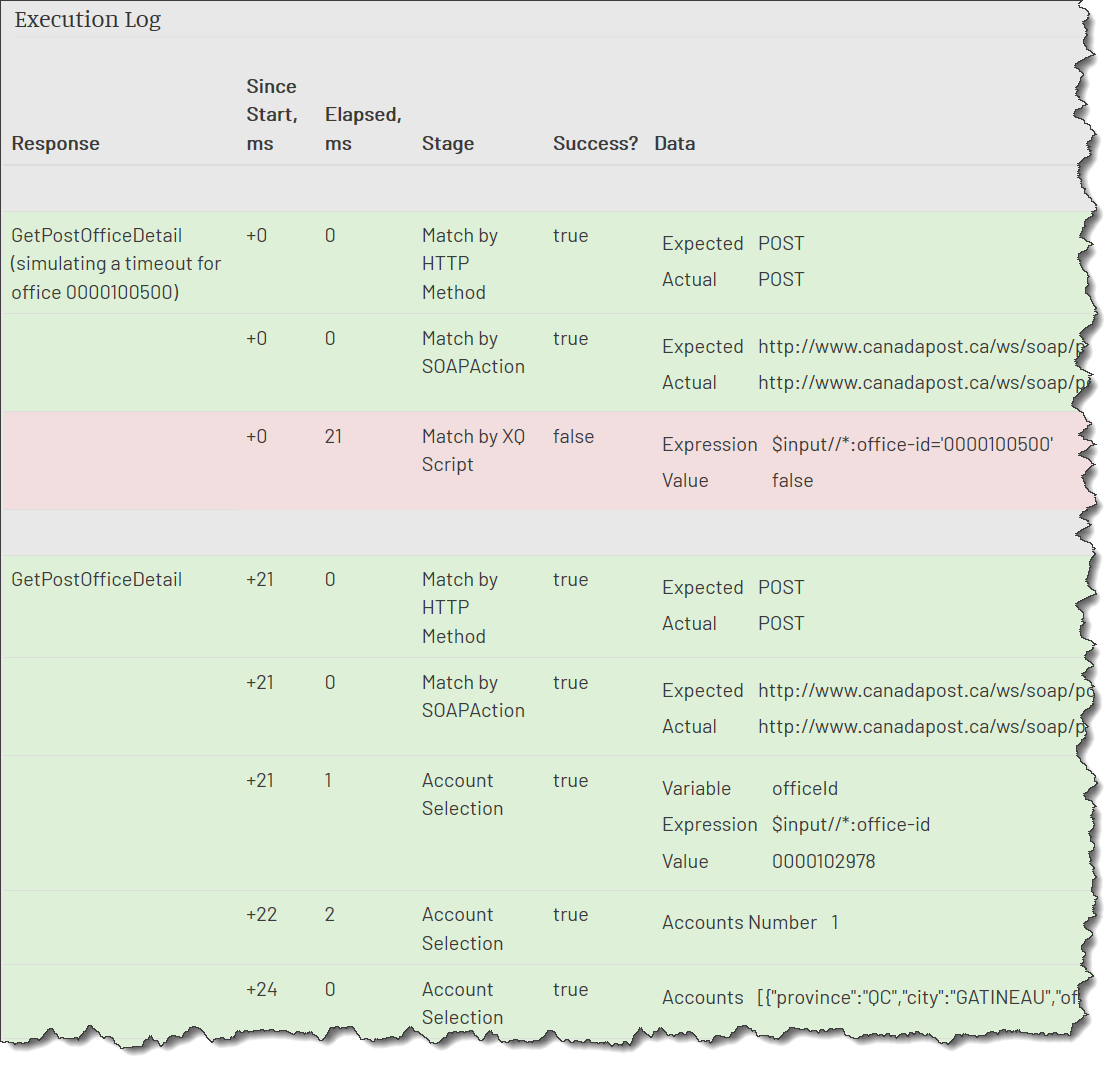
As you can see from the above log, the first reaction that the MockMotor has tried was GetPostOfficeDetail for account 0000100500.
1 The POST method is matching
2 The SOAPAction value is matching
3 The script is NOT matching. MockMotor continues with the next reaction.
The next reaction is also GetPostOfficeDetail, but a generic one.
1 The POST method is matching
2 The SOAPAction value is matching
3 Account selection has found a matching account.
4 (And so it continues until it logs the final response.)
Timings
There are execution times in the table. These are the overall time since the beginning of the execution and the time that each step took.
These values may help to find reactions or expressions that took too a long time to execute. You can then optimize them or move them down the list to remove their effect on other reactions.